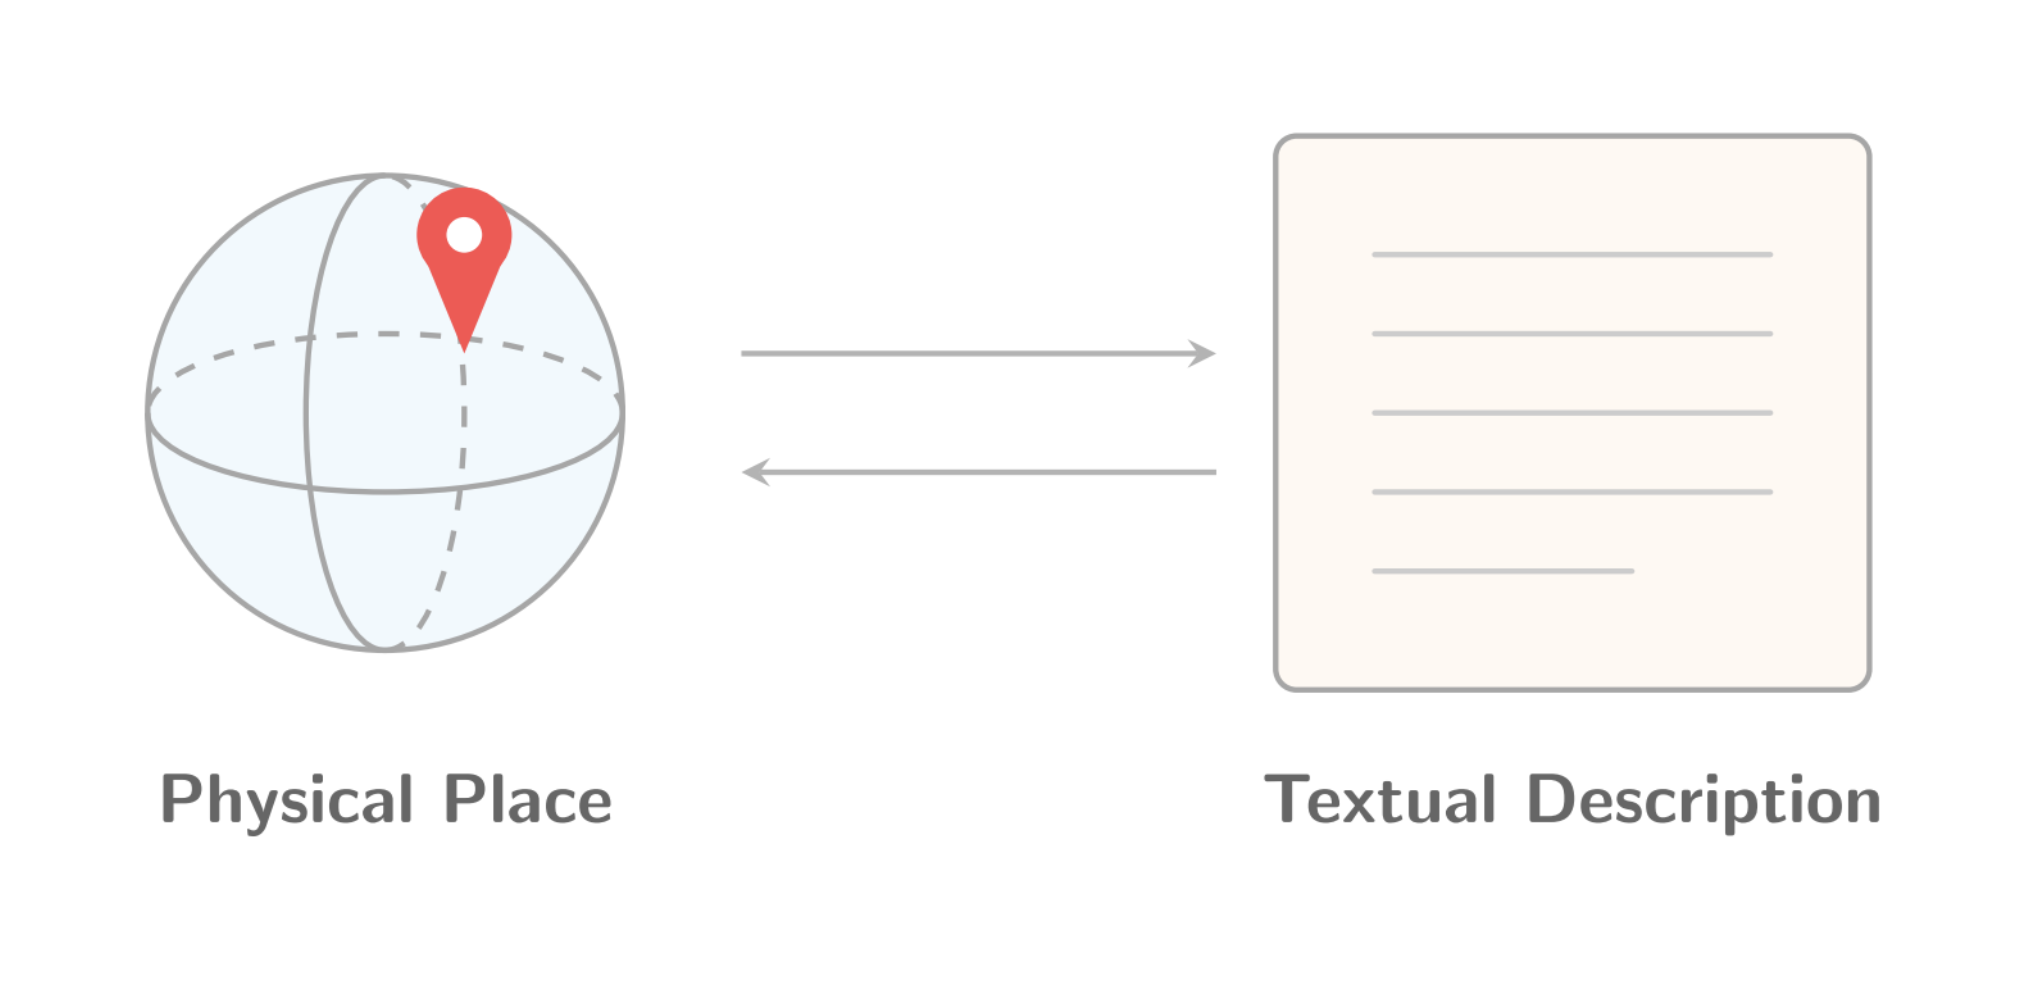
If you pick a given place on Earth, you are very likely to find a satellite image for it. There are at the very least hundreds of satellites in orbit capable of producing some sort of Earth-observation image. From these images, we are able to extract a lot of useful information for downstream applications like disaster management, urban growth planning, climate monitoring and so on.
However, as useful as these images can be, they still only cover a subset of what we know about a place. When was this building built? By who? Does this place have any historic significance? What about the fauna living under these trees? Has this place always been a forest? As one can quickly notice, there is a sallient need to go beyond what satellite images have to offer. Some information has to be captured using other mediums and text is one of these.
Now the great news is that we have plenty of text, and we have been writing text for a while! But in order to be useful here, this text cannot just be about anything. It has to be bounded to the place we are trying to describe. But how do we ensure this is actually the case? How can we be sure this text is not describing the neighborhood beside instead of the one we are interested in? How do we make sure this text is relevant to the topics we are care about?
In this blog post, which is meant to be the first part of a series, we are going to take a step towards answering these questions. We are first going to understand how do we geolocate a place on Earth (i.e giving it a specific and unique geographic position), before moving on to the first low hanging fruit one can pick in order to describe it through text.
Giving a geographical footprint to a given place on Earth
The first level of description we can give to a place is to give it coordinates (e.g longitude and latitude). This way, if I want to describe the airport of Pau (France), we can give it the following coordinates:
{"coordinates": [-0.41787127177786765, 43.37980977446927], "type": "Point"}This is a great way to localize any given place on Earth. Below (Figure 1) is a little diagram for you to understand what is the definition of the latitude and the longitude we are using here.
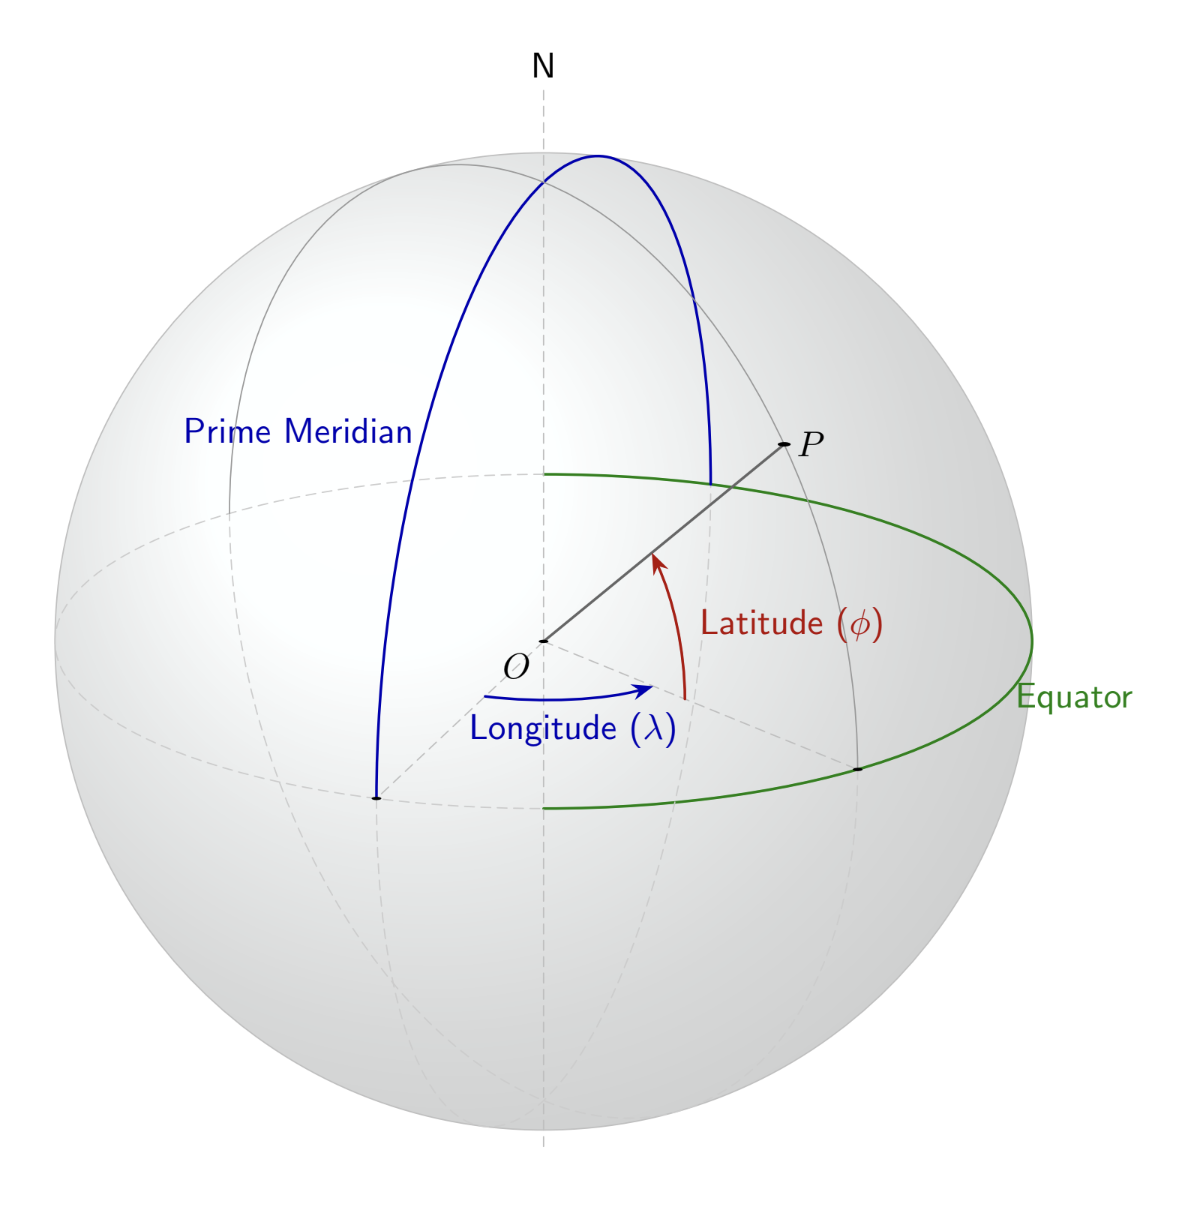
Latitude tells you how far north or south a place is from the Equator, which is the imaginary line around Earth’s middle at 0° latitude. Longitude on the other hand tells you how far east or west a place is from the Prime Meridian, the imaginary line passing through Greenwich at 0° longitude.
This is a good starting point (pun intended), but it’s still an imprecise approximation. Indeed the airport we are talking about is not just a point on a map, but it is an area. That’s why a more precise way to describe this place is to give it a geometry, which we will name a polygon (since it is made of multiple edges). In the case of our airport, a cropped version of its geometry would look like so:
{
  "coordinates": [
    [
      [
        [
          -0.436569,
          43.3884943
        ],
        ...,
        [
          -0.4361451,
          43.3890649
        ],
        [
          -0.436569,
          43.3884943
        ]
      ]
    ]
  ],
  "type": "MultiPolygon"
}
As you can see this time we don’t have a single (longitude, latitude) point but rather a list of such points, which all together form a polygon. You can find out such information about many places on Earth on Open Street Map (OSM), which is an open license map of the world maintained by many people across the globe. Another great example of open source project :)
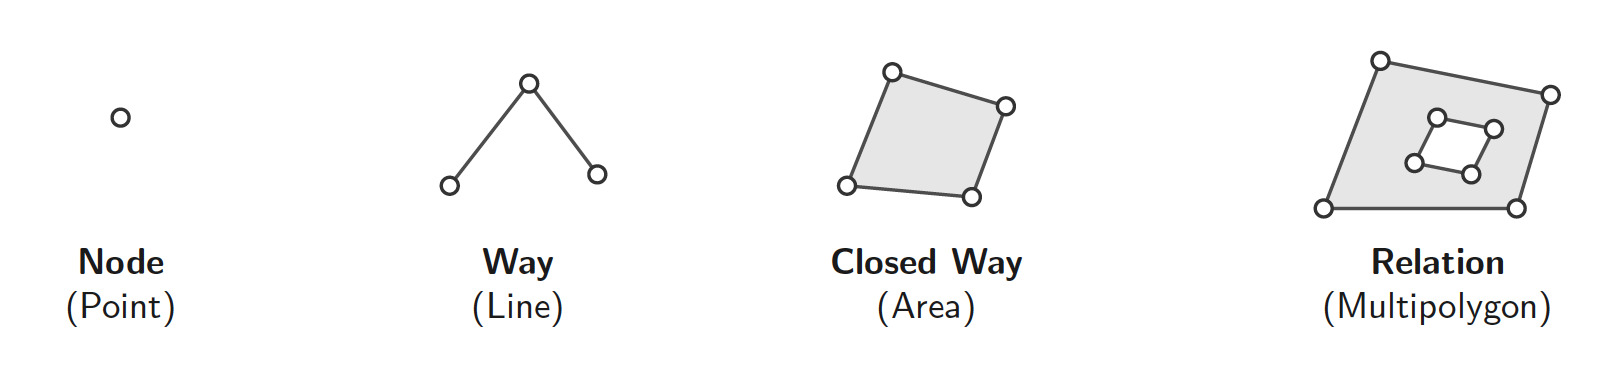
On Open Street Map you will find different kinds of geometries as shown in Figure 2:
- Node: A node is a single coordinate (longitude, latitude) and it is used to describe an object as a single point. You would generally find this kind of geometry for tiny objects (e.g a bench, a tree and so on).
- Way: A way is an ordered list of nodes, essentially describing a line. This could be used to represent a river or a road for instance.
- Closed way: The name speaks for itself. It is basically a way whose first and last node are the same. You could use such a geometry for a building, a lake, a field…
- Relation: A relation allows you to combine geometries and have complex structure with multiple polygons. You could describe a location with outer parts or holes. You could for example use a relation to describe a building with an inner courtyard.
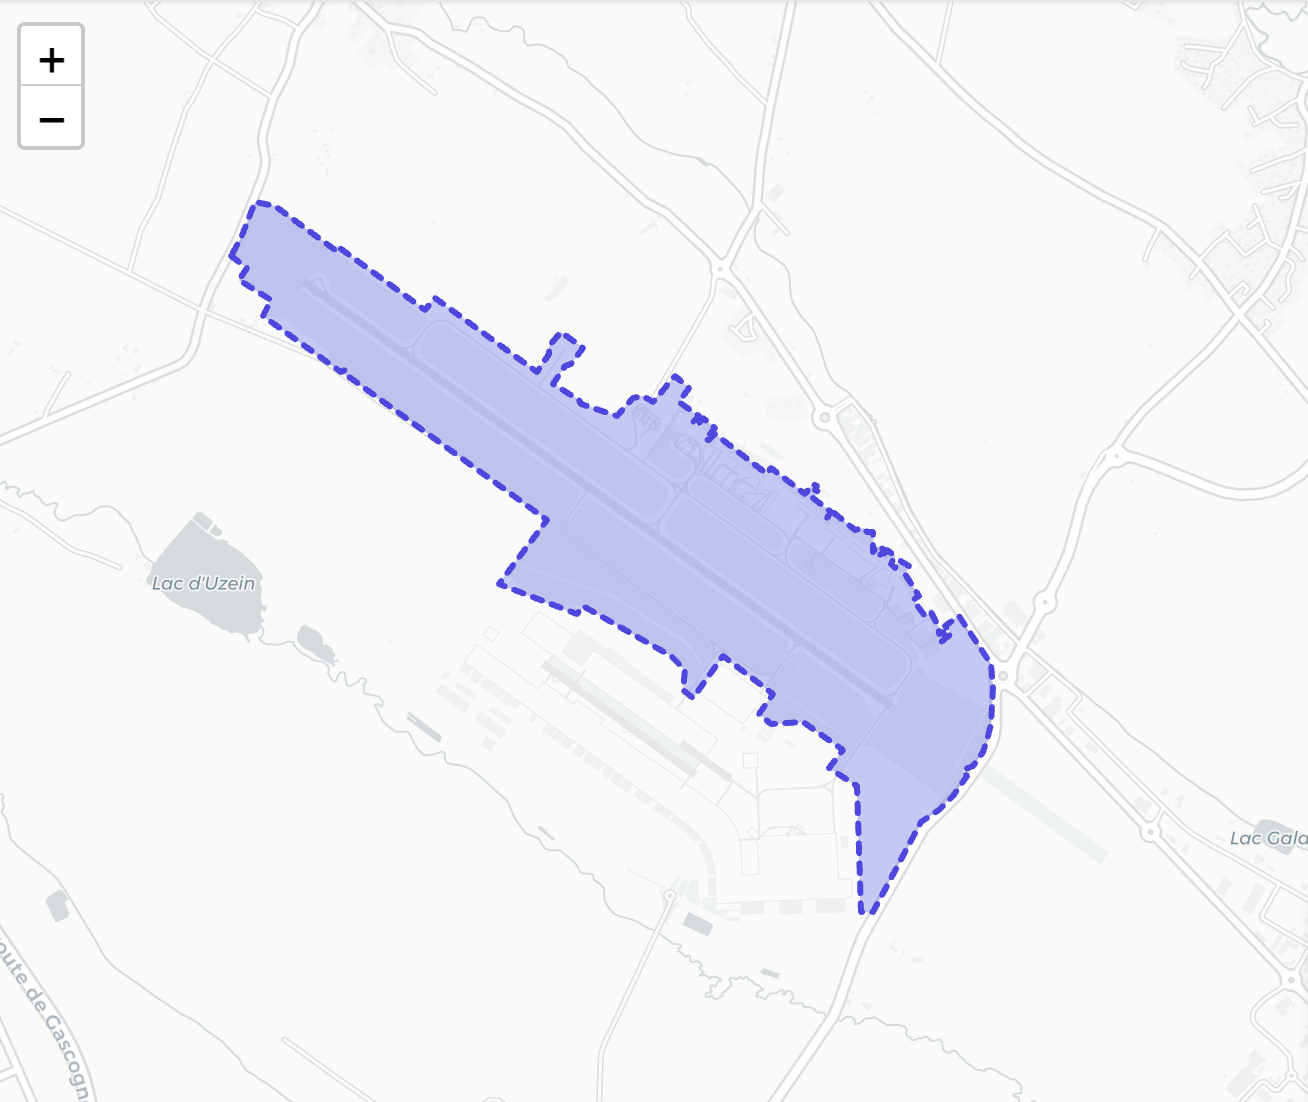
Now, coming back to our airport, if we were to plot these points on a map we would have the following object (Figure 3), which gives boundaries to our airport.
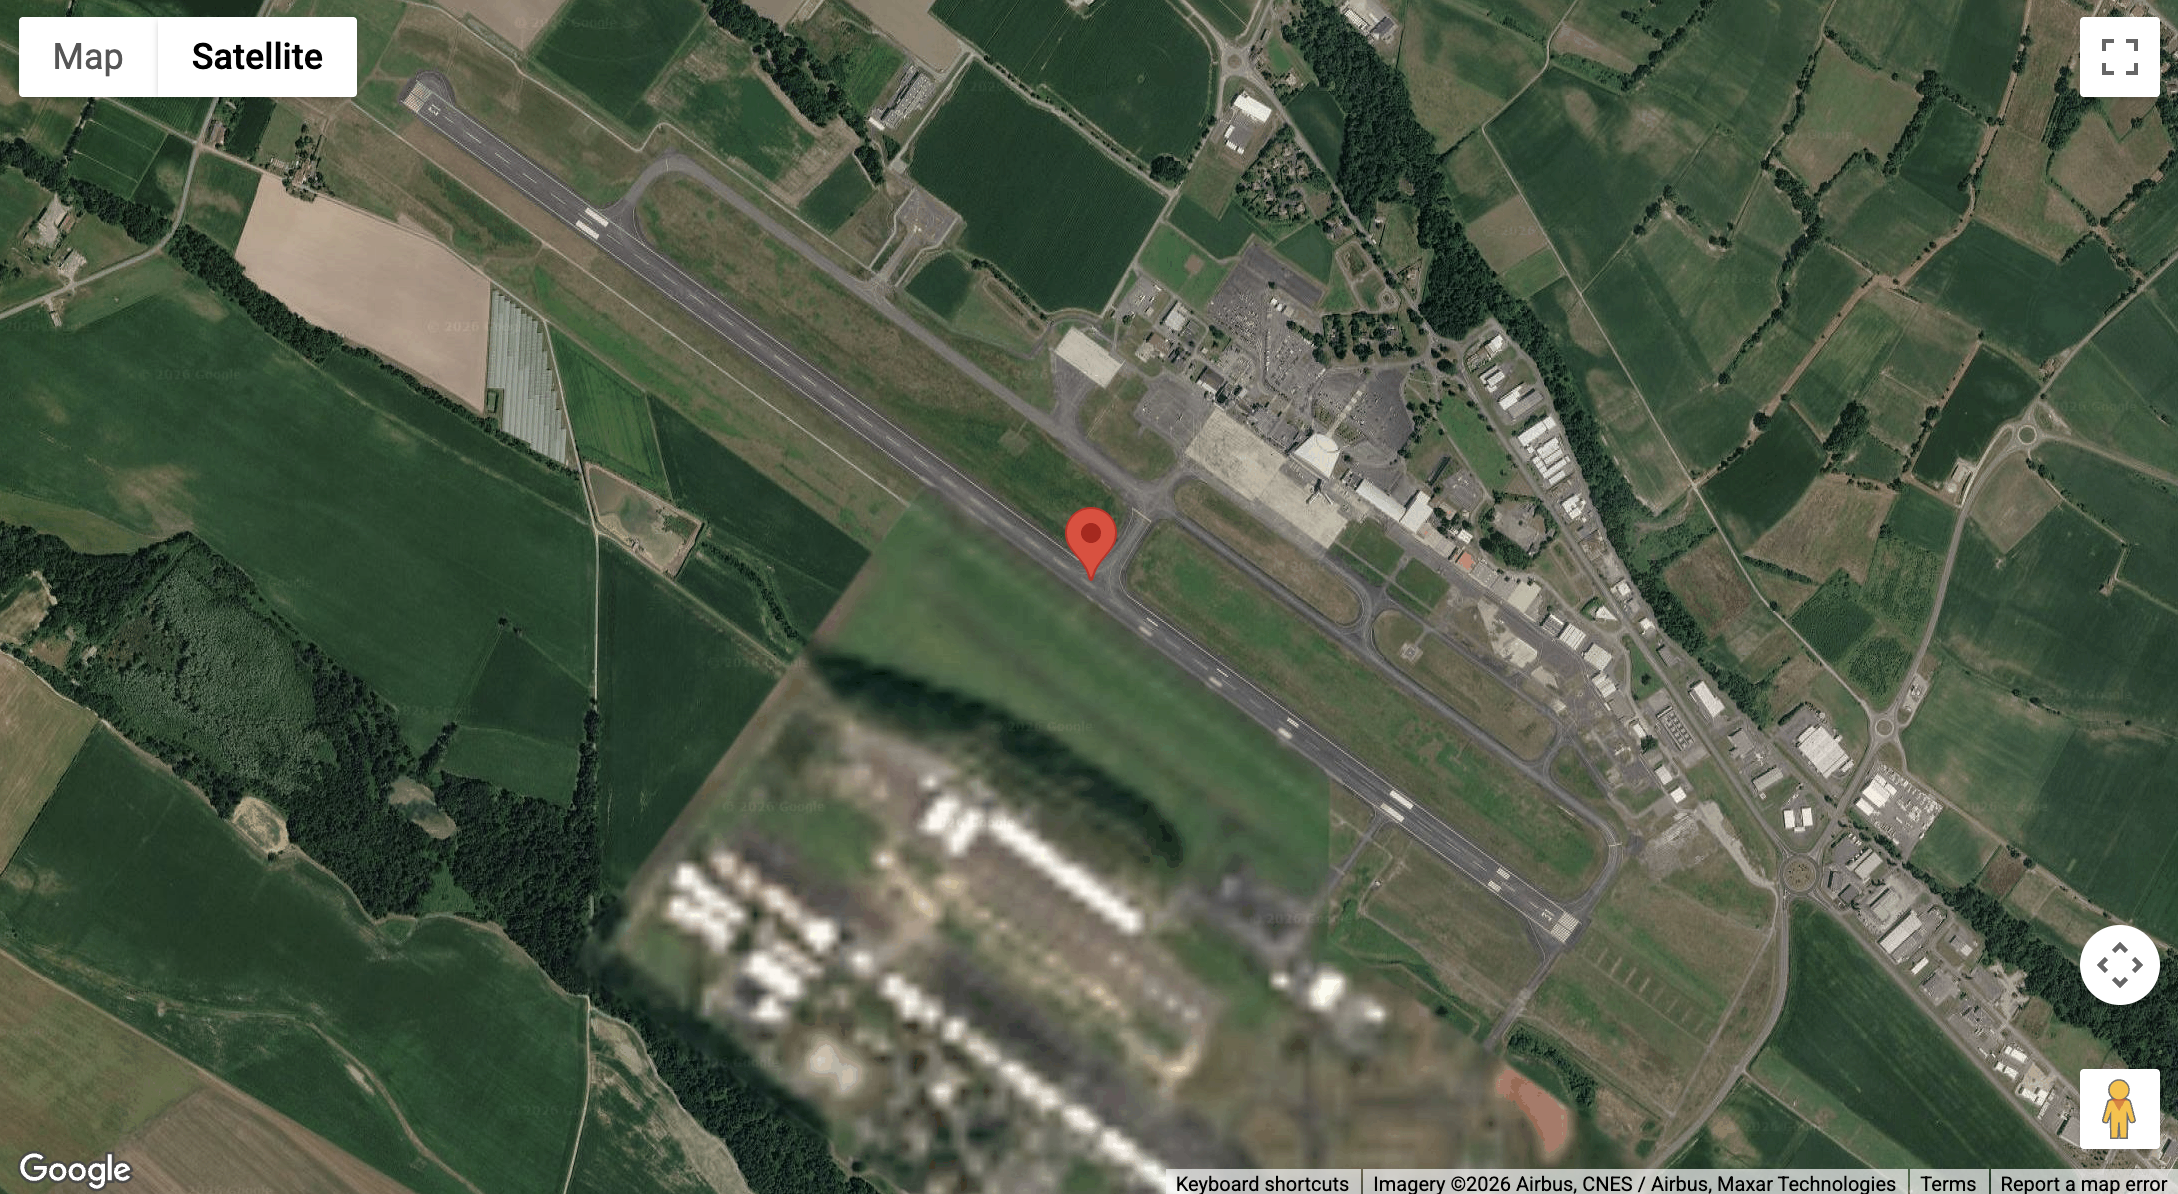
Using this geometry we could then further describe it with some statistics and find out that its area is of . Using its coordinates, you could now also overlap some satellite images to describe the place with some visual signal (Figure 4). But what is going to be our interest here, is to find some textual description of this place.
Giving a textual description to a given place on Earth
Many objects you would find on Open Street Map can come with “tags”. For example in the case of the airport of Pau, here are the tags associated:
{"aerodrome":"international",
"aeroway":"aerodrome",
"city_served":"Pau",
"ele":"188",
"iata":"PUF",
"icao":"LFBP",
"name":"Aéroport de Pau Pyrénées",
"name:en":"Pau Pyrénées Airport",
"name:oc":"Aeropòrt de Pau-Pirenèus",
"operator":"Pau Chamber of Commerce",
"operator:type":"public",
"phone":"+33 5 59 33 33 00",
"source":"wikipedia",
"website":"https://www.pau.aeroport.fr/passager/",
"wikidata":"Q1432335",
"wikipedia":"fr:Aéroport Pau-Pyrénées"}
As you can see there is a lot of information packed in there. Just by looking at the tags, we can already understand that this is an international airport, located in Pau at an elevation of 188m above the sea level, its airport code is PUF and so on. However this information is scattered and usually only containing a few words. There is no sentence structure, no proper text content you could use to fine tune an LLM for example.
But if we look closely, on some Open Street Map objects, we can find a tag “wikidata”. This is a unique identifier, and luckily our airport has one: “Q1432335”. Now that we have this identifier we can automatically construct the following URL with it:
https://www.wikidata.org/wiki/Q1432335
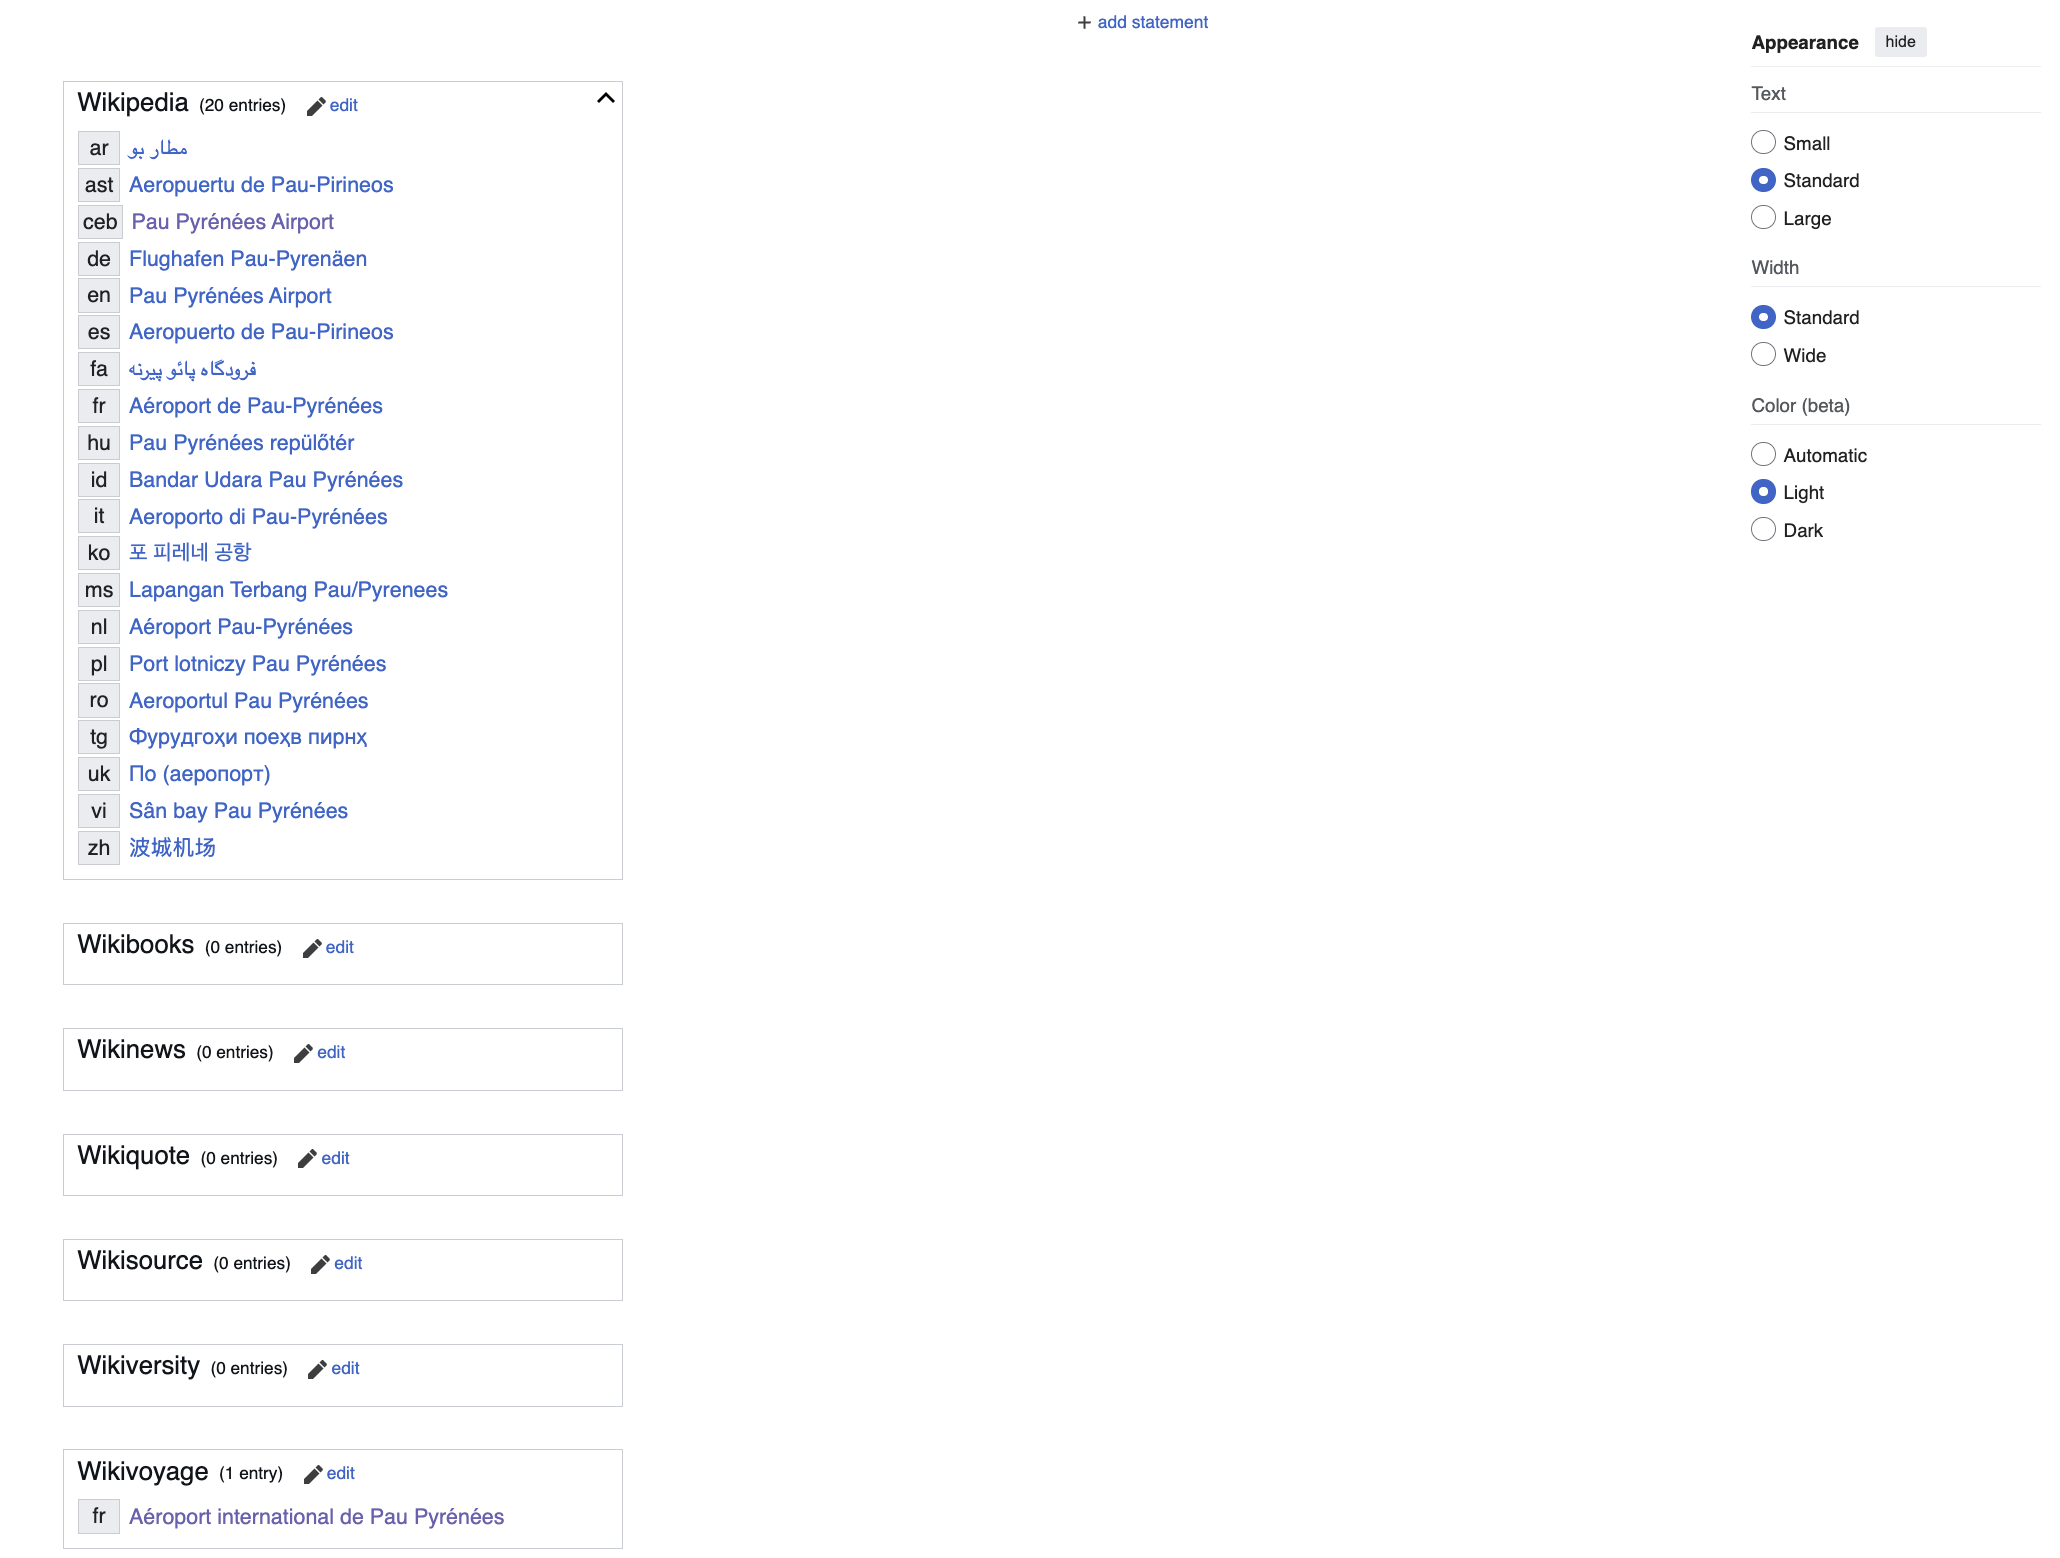
Thanks to this URL, we are going to be able to retrieve some sitelinks from Wikidata for our airport. The good news is that this time, we will have access to a mine of gold, not merely some tags. In the case of our airport, following the URL mentionned above, we can see that we have 20 Wikipedia articles covering this object (in 20 different languages, one for each language), as well as a Wikivoyage article. Figure 5 displays the different sources we can find for this object.
I don’t think I need to introduce Wikipedia to you, but it is obvious that this time we are going to often come across rich textual descriptions, coming with references and sometimes images, which is much better than mere tags to describe a place!
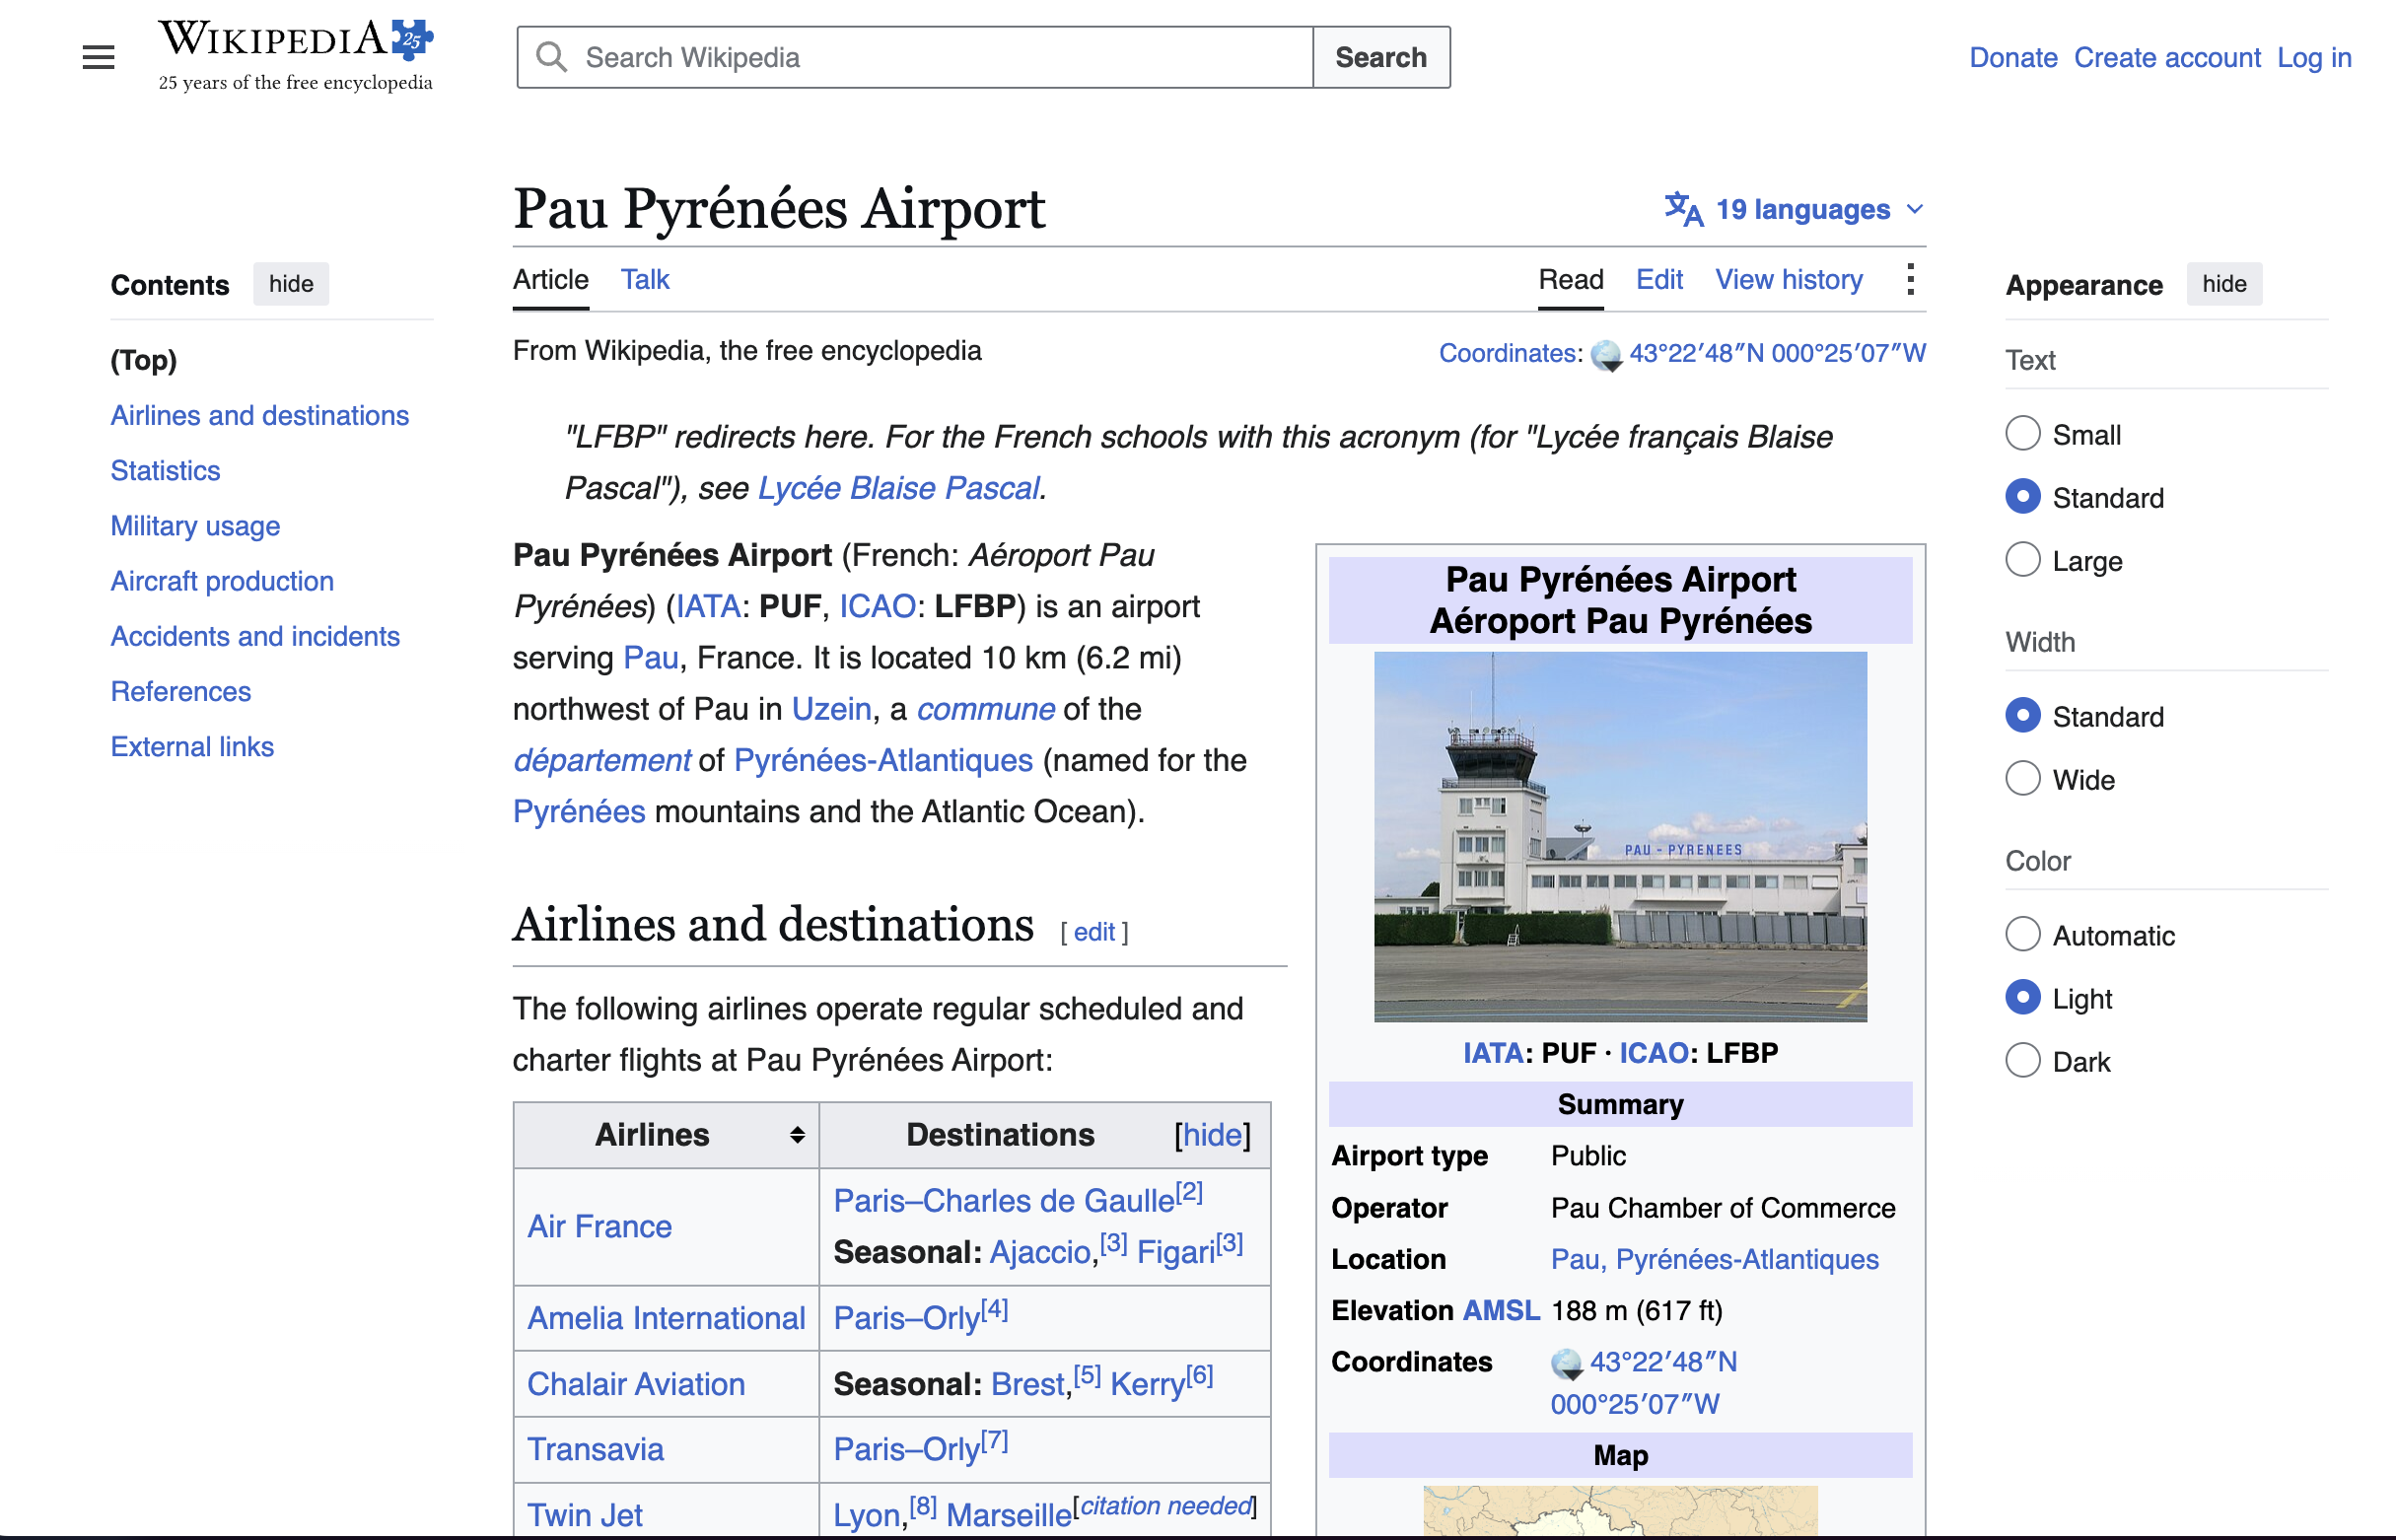
Let’s have a look at the English Wikipedia article (Figure 6). As you can see there is a lot of information in here as well. The first thing to notice is that there is both text and image to describe the place, which can be very interesting for multimodal purposes.
Some other interesting things to note are that we now have proper sentences describing our airport, with references (text in blue). Another useful thing is that this text comes in sections. For example there is the “Airlines and destinations” section. This can matter for processing this text later. Suppose for downstream purposes you were only interested in the geographic side of a place, you could easily filter for sections having the word “geography” in their title (the section “Geography” appears to be quite standard), if any such section exist, and already have high quality geography related descriptions for the place you are studying!
So up until here, we know how we can geolocate a place on Earth, how to give it a geographical footprint (a polygon, a node and so on), and how we can easily give it a textual description. The next step is to scale this beyond our little airport and start looking at what does this approach can yield worldwide. We will then be able to answers great questions on the geographical coverage our text is having or the distribution of languages covered by such descriptions. Let’s go?
Building a wordlwide dataset of geographical footprints <-> text descriptions
Up until here, I have presented to you what does exist out there to get some textual descriptions for some places on Earth. From here I am going to describe a simple dataset I have been building and analyzing my findings from the data.
You can find the dataset on Hugging Face at : https://huggingface.co/datasets/NoeFlandre/osm-polygon-wikidata-only
As well as the code on my GitHub at: https://github.com/NoeFlandre/osm-polygon-wikidata-only
For us to get a first idea of the scale we are going to deal with, we can visit the Taginfo website. Taginfo is an amazing place to analyze the data available on OpenStreetMap. You can see the different tags used by mappers, their occurences, their geographic and temporal distribution and so on. In our case, we are interested in knowing how many instances on OpenStreetMap do have a “wikidata” tag.
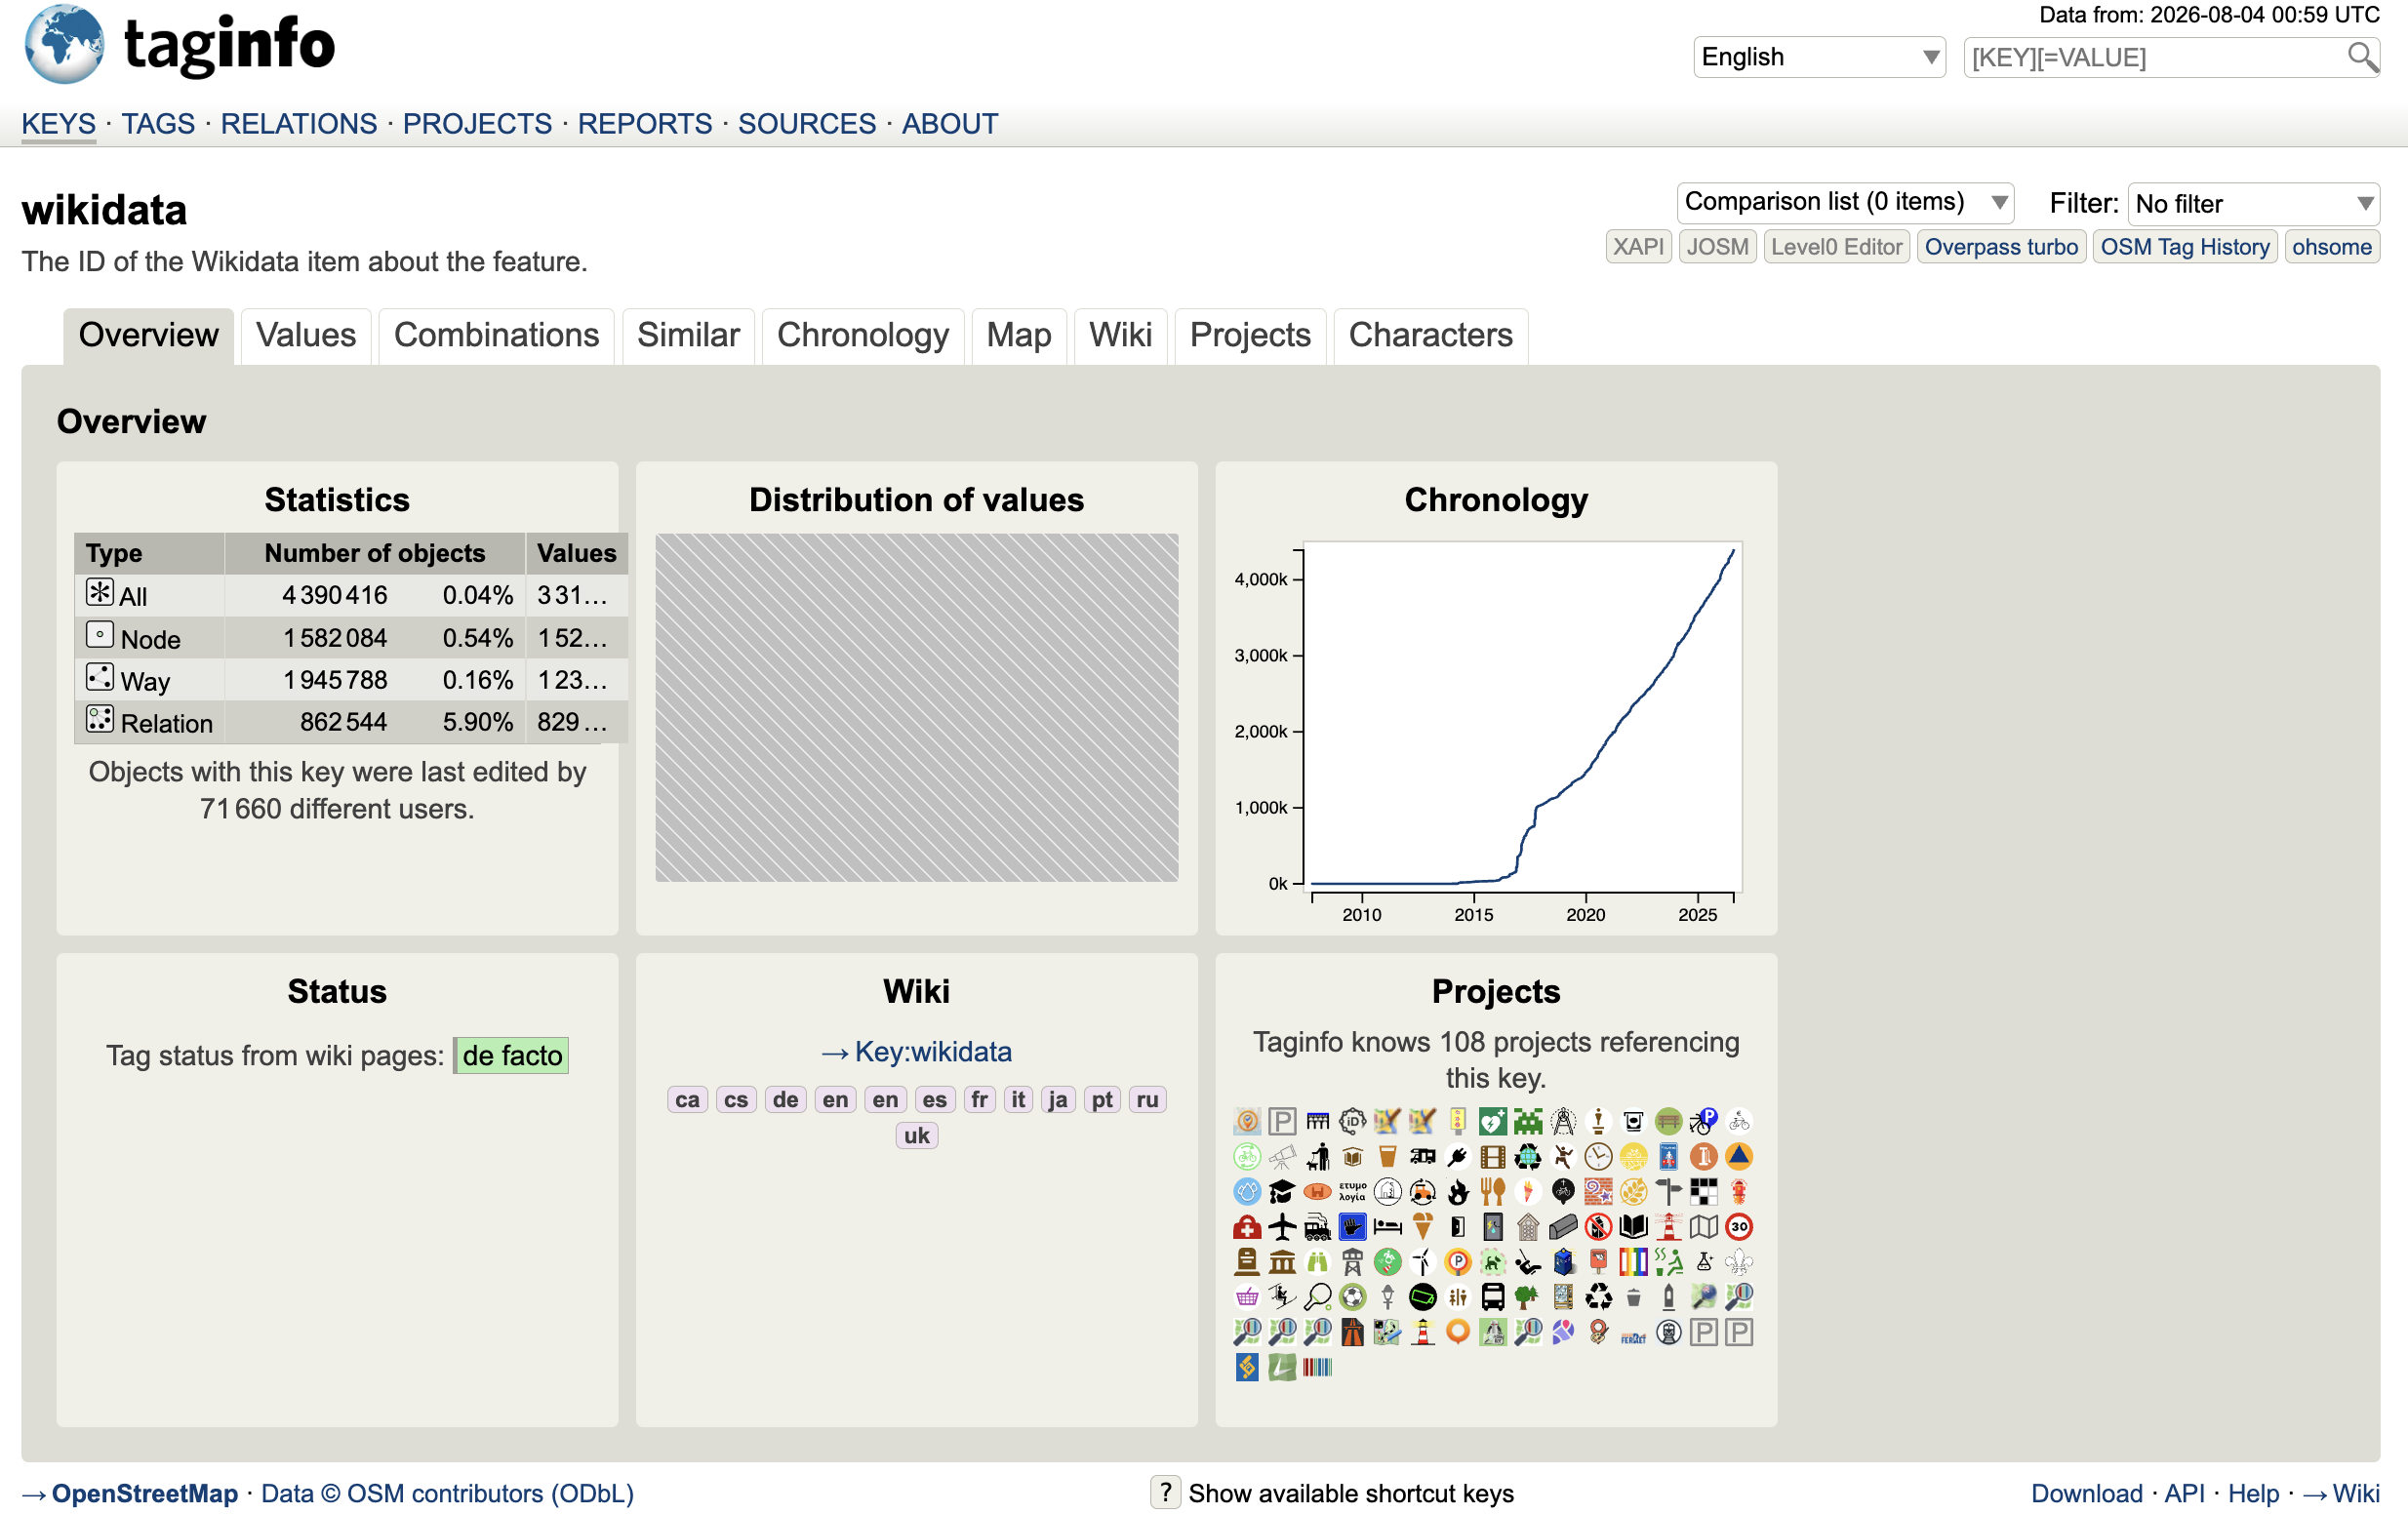
By looking at Figure 7, we can already see that we are dealing with millions of instances.
In order to build a worldwide dataset of such pairs of geographical footprints and textual descriptions, we first need to access all polygons we are interested in (in my current endeavours, I am not interested in dealing with nodes, but the logic is just the same). You could use an API in order to extract these polygons, for example using the Overpass API, however at this scale you would certainly very quickly hit some rate limits. A simpler approach then is to download what we call OpenStreetMap Data Extracts using the Geofabrik platform (Figure 8).
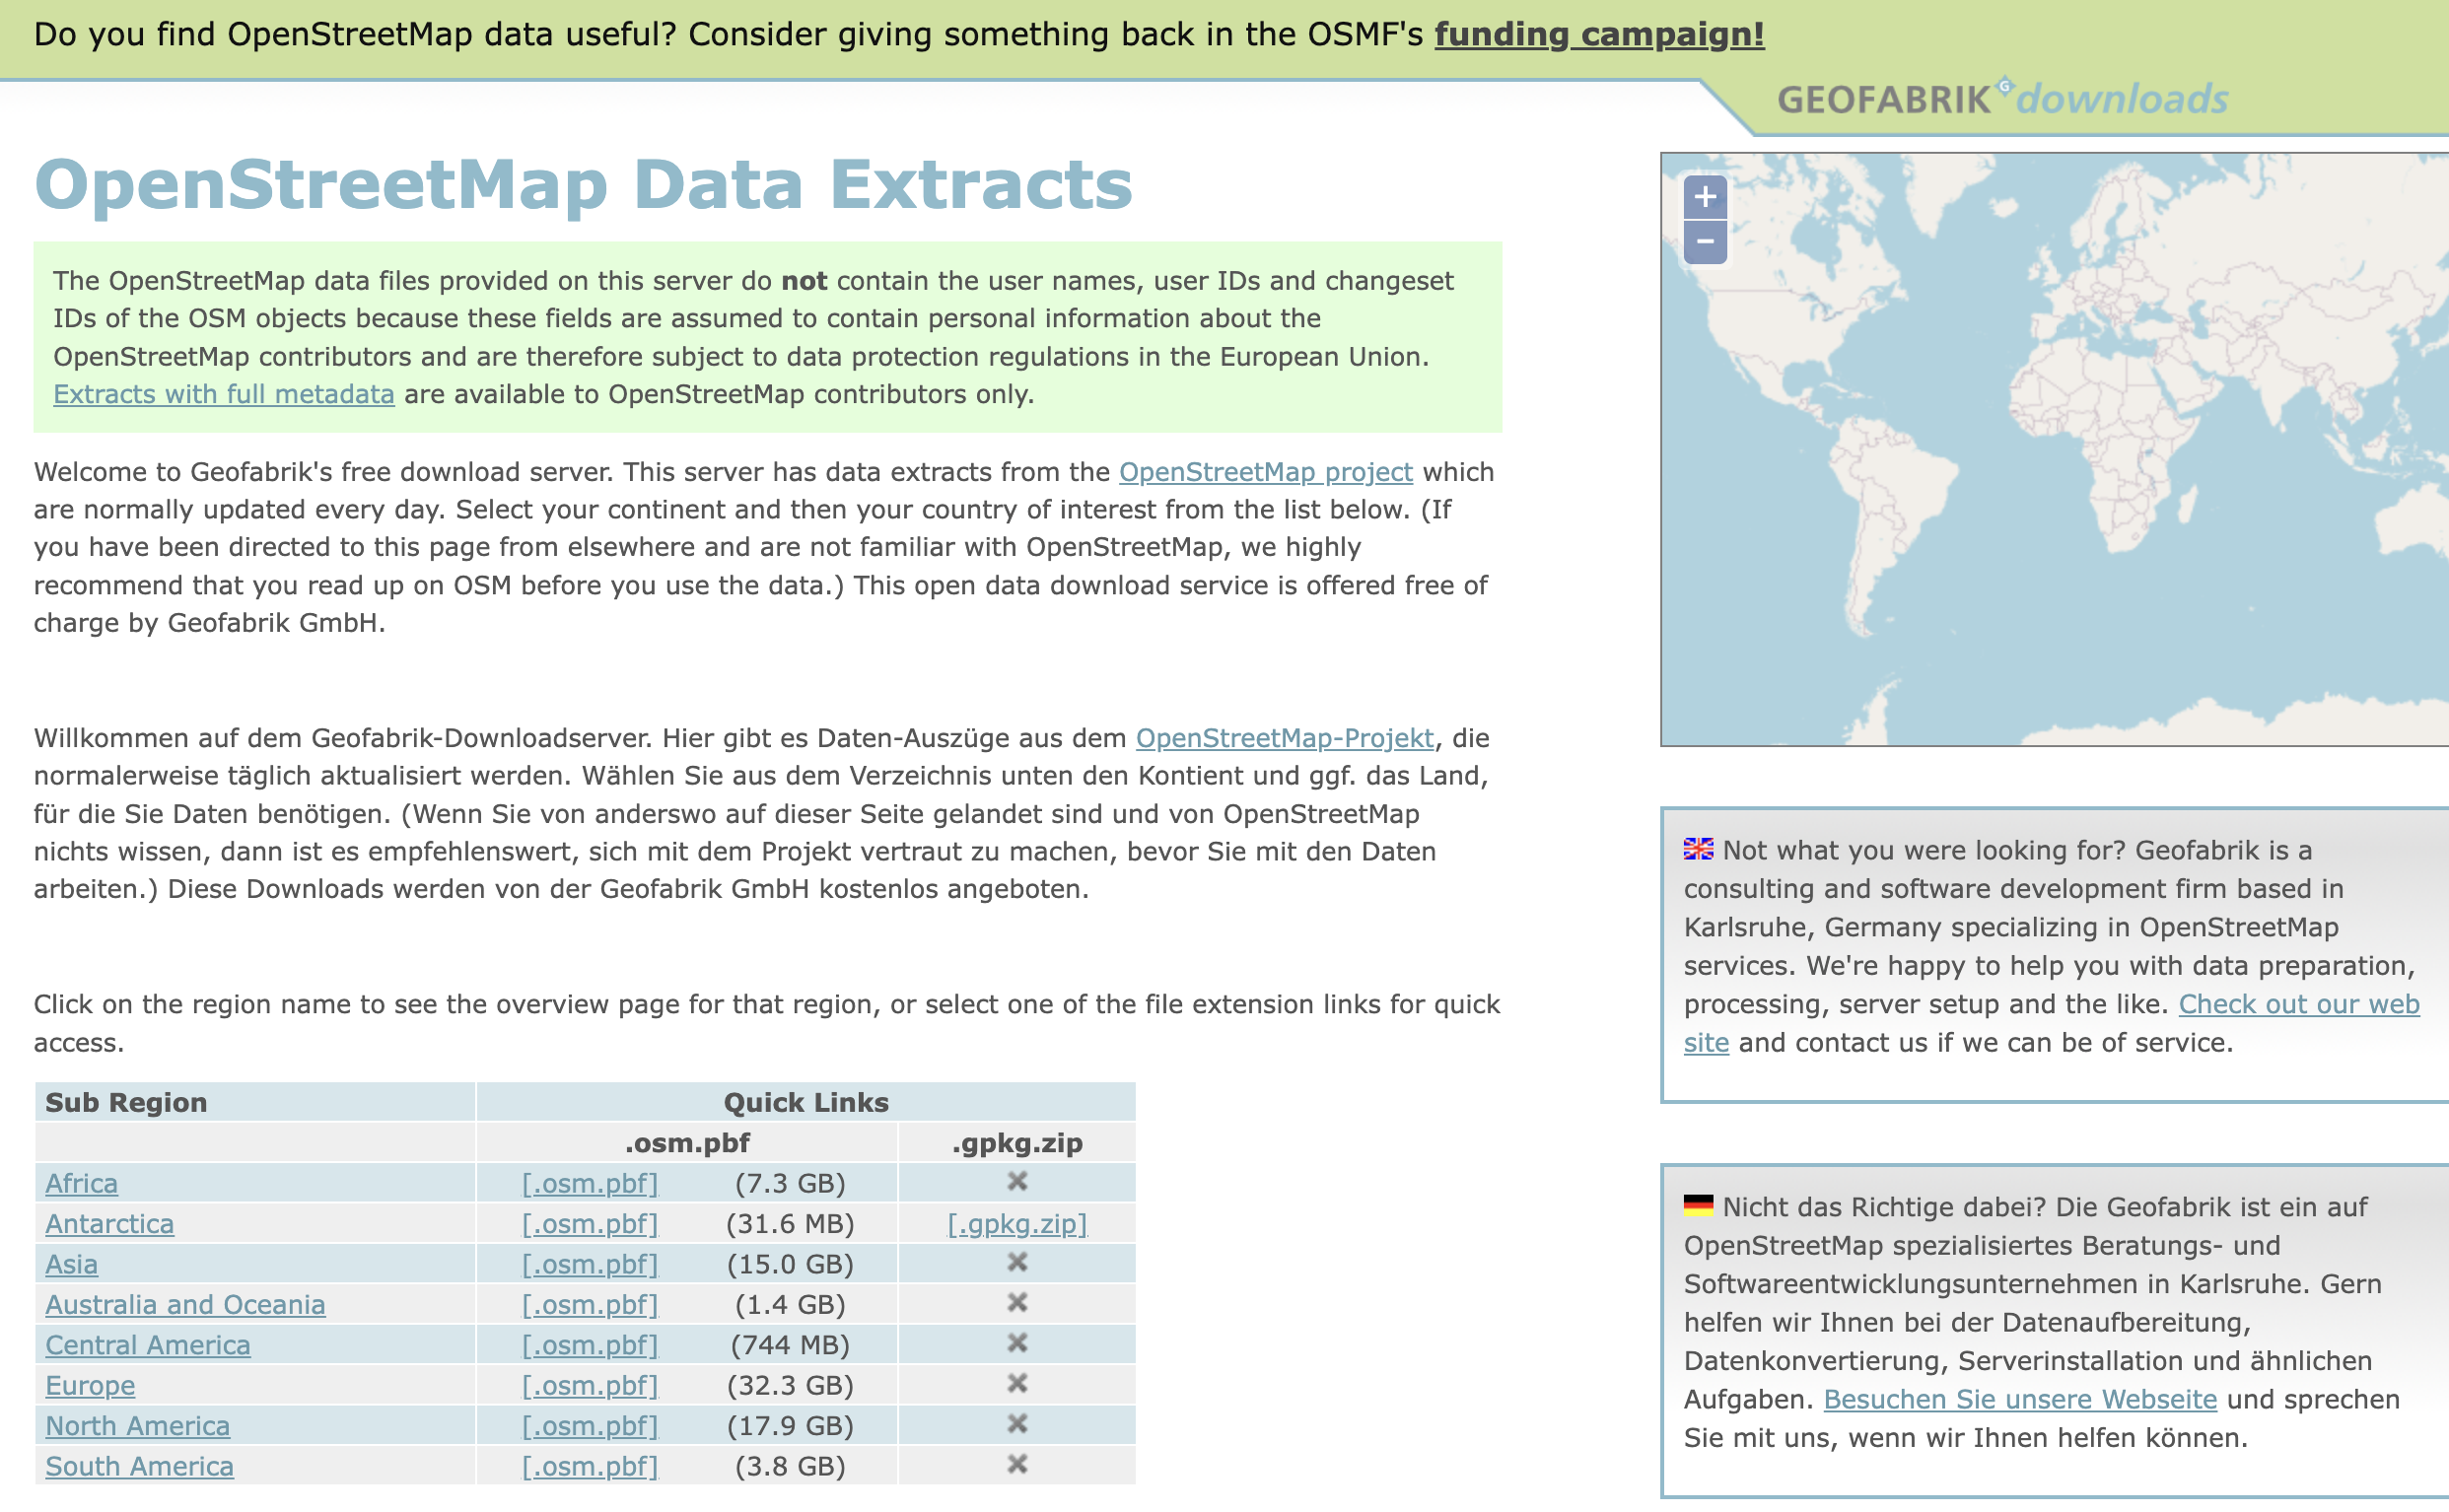
Geofabrik is a German company which is providing daily updated data from OpenStreetMap. A very convenient service they have is a bunch of open access data extracts for each region on Earth and this is exactly what we are looking for.
You can therefore easily download these extracts which are PBF (Protocolbuffer Binary Format) files. This format is basically a highly compressed binary file primarily used to stored Open Street Map data. What makes it pretty useful is that they are providing this data at different scale. For example you could choose to download the entire Europe in one shot or split it in different files (one per country, or one per region within a country).
I am choosing a middle ground depending on the size for my dataset. When a file is not too heavy I am downloading it no matter the scale. For instance I am downloading Antartica in one go since it has very few data while for France I am rather splitting at the region level to keep things manageable since it is much more furnished.
Once all data extracts are downloaded, I have 375 items worth roughly 83 GB. That’s a good chunk of data. You may already notice, just by looking at Figure 8 and the storage for each continent, that the world is heavily imbalanced in terms of OpenStreetMap geographical footprints coverage. We have clusters with a ton of data like Europe worth 32.2 GB of data while some regions are widely under covered like Africa worth only 7.3 GB of data while having an area 3 folds larger.
Out of all these extracts, I am choosing to only keep geometries being either closed ways and relations and having a “wikidata” tag. Based on these tags and on the interest of my own research, I am then deciding to fetch all Wikipedia and Wikivoyage articles matching any language. In order to fetch these articles, I am using the MediaWiki Action API. Therefore for each polygon matching the filters described above, I am querying the API with its wikidata identifier and fetching the text I am interested in. Note that by default the API will consider you “Anonymous” and your rate limits will be very limited. You can raise your limit ceiling higher by creating a bot on their page.
Analyzing the data
Now comes the exciting part where we can show great tables and sleek plots! Let’s have a look at the data this pipeline gave us.
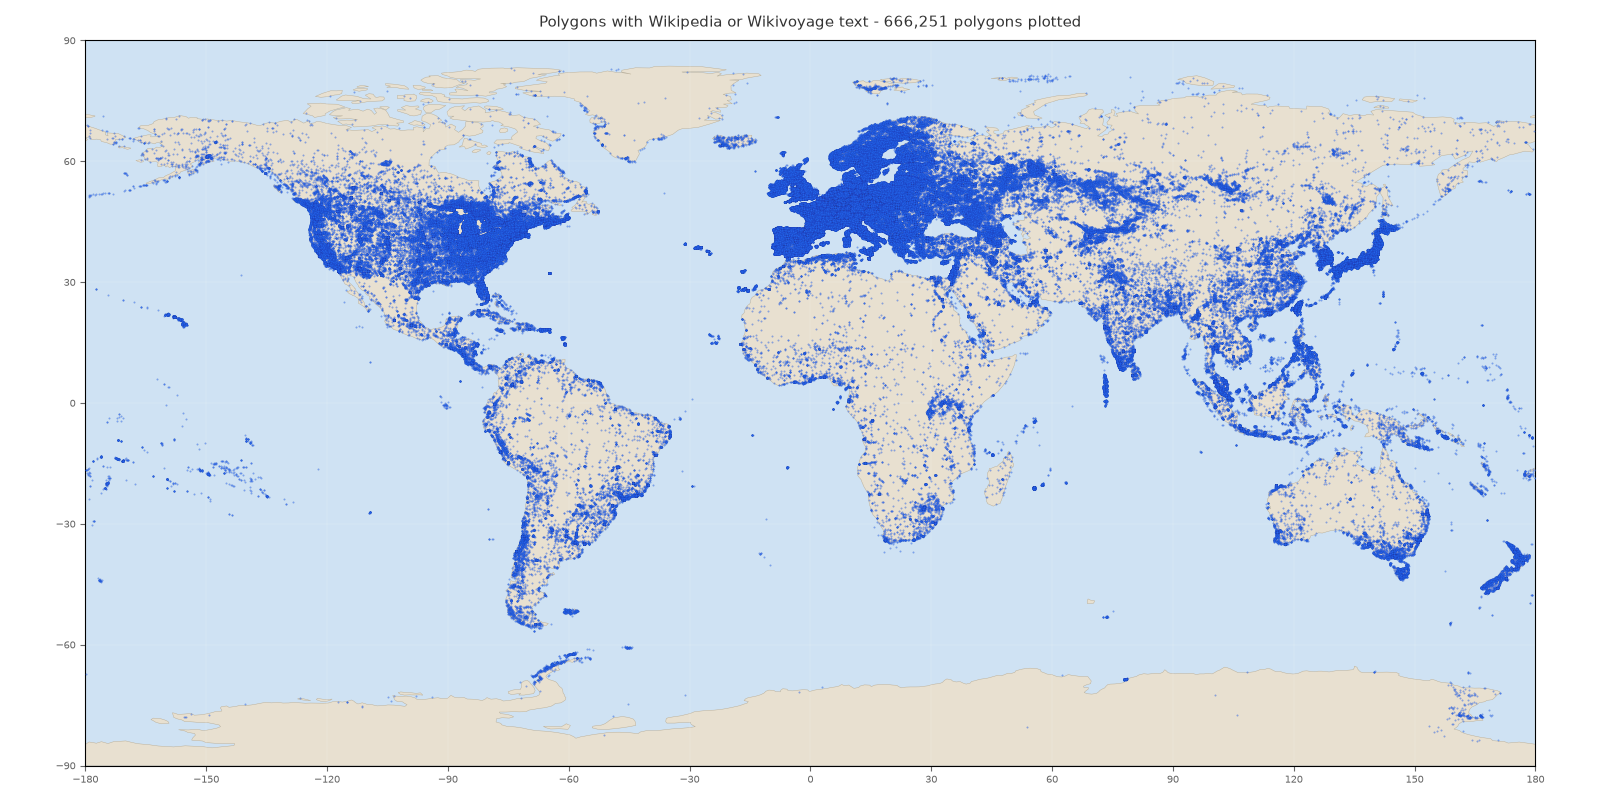
The first thing we may want to do is to look at all polygons for which we found at least one article from either Wikipedia or Wikivoyage with non-empty text. This would give us a great idea of the geographical coverage of our textual descriptions.
As we could have easily expected, Figure 9 shows us that this textual coverage from wikidata is highly imabalanced and heavily skewed towards certain regions. Europe is having a very important density of polygons with textual description compared to the rest of the world. Similarly some specific other regions are nicely represented (e.g the Australian coastline, South Korea, New Zealandand, North America, Japan…).
Conversely, and as anticipated earlier, regions of the world like Africa are highly under represented by wikidata textual descriptions. Note also that there are 666,251 polygons having non empty text while the number of polygons having a wikidata tag is of 1,184,110. This may be due to several reason (e.g a polygon can have a wikimedia_commons image associated but not a textual article)
Now if we look at more descriptive statistics, Table 1 might help us judging of the scale of the textual coverage.
| Metric | Value |
|---|---|
| Number of polygons | 1,184,110 |
| Number of languages | 351 |
| Number of Wikipedia documents | 2,273,750 |
| Number of Wikipedia sections | 11,997,165 |
| Number of Wikivoyage documents | 14,420 |
| Number of Wikivoyage sections | 302,200 |
| Number of Wikipedia + Wikivoyage document words | 801,528,334 |
Table 1: Descriptive statistics of the dataset
The pipeline used gave approximately 1,2 millions polygons, which matches the scale we expected from the Taginfo website. However half of them do not have any textual description. The diversity of articles fetched is substantial since they cover 351 different languages for a total of more than 800 million words. We can also notice that there is a great imbalance between Wikipedia and Wikivoyage, the former holding the major proportion of our dataset.
| Language | Documents | % of total | Polygons with non-empty text |
|---|---|---|---|
| en | 223,301 | 10.1% | 238,950 |
| de | 146,312 | 6.6% | 158,550 |
| fr | 109,720 | 5.0% | 120,451 |
| ceb | 105,479 | 4.8% | 113,410 |
| sv | 74,518 | 3.4% | 79,076 |
| ru | 73,228 | 3.3% | 80,023 |
| es | 70,808 | 3.2% | 78,504 |
| it | 65,927 | 3.0% | 74,554 |
| pl | 65,685 | 3.0% | 70,164 |
| zh | 59,285 | 2.7% | 64,758 |
Table 2: Top 10 languages covered in the textual descriptions
Looking at Table 2, one would not be too surprised to see the highest proportion of documents being written in english, german or french. However the reader will likely be more surprised to find out that the Cebuano language (second most spoken language in the Philippines) holds a fourth position as the most represented language in the corpus. Curious about the reason behind this “outlier”, I investigated and found out that the person responsible behind this is Sverker Johansson. He is the creator of Lsjbot, an automated Wikipedia article-creating program. Johansson focused a lot on this language since his wife is a native speaker. I found the story too interesting not to share it :)
Coming back to our numbers, one last thing I would like to share about the dataset is that the top 10 language in Table 2 account for 45.1% of all Wikipedia + Wikivoyage documents. So the diversity in languages is also highly imbalanced.
Let’s wrap this up
What should be your takeaway from this blog post?
We started by asking ourselves how could one describe a place on Earth. We saw that the simplest way to locate a place on Earth was to give it a single coordinate, also named a node (longitude, latitude). We then further saw that we can use platforms like OpenStreetMap to retrieve information about a place on Earth. This led us to realize that we can give objects more complex geometries than a simple node, namely a way, a closed way or a relation.
Later on we also noticed that objects on OSM are having some tags, which are a good starting point to describe objects with much diverse information. Specifically we made good use of one kind of tag: “wikidata”. This helped us retrieve wiki articles from diverse sources and for multiple languages. This gave us rich textual descriptions for a place on Earth.
However we saw that the resulting dataset is highly imbalanced geographically, with most described places belonging to what we may call “developped countries”, as well as language-wise since only 10 languages cover almost half of our dataset.
In upcoming blog posts, we will extend this methodology in order to expand our dataset and try to find out new methods to further describe the Earth!
Acknowledgment
I would like to give special credit to the reviewers of this blog post early draft, namely Hugo Riffaud de Turckheim and Aritra Roy Gosthipaty. Their feedback greatly helped in shaping the current version of this post and improve its quality.